Technicals Dashboard
Overview
Empowering Traders : Free Tool
Objective
To create a completely free tool which provide traders a quick overview of Top Gainers and Losers, Volume and Range Breakout across all the major indices.
Background
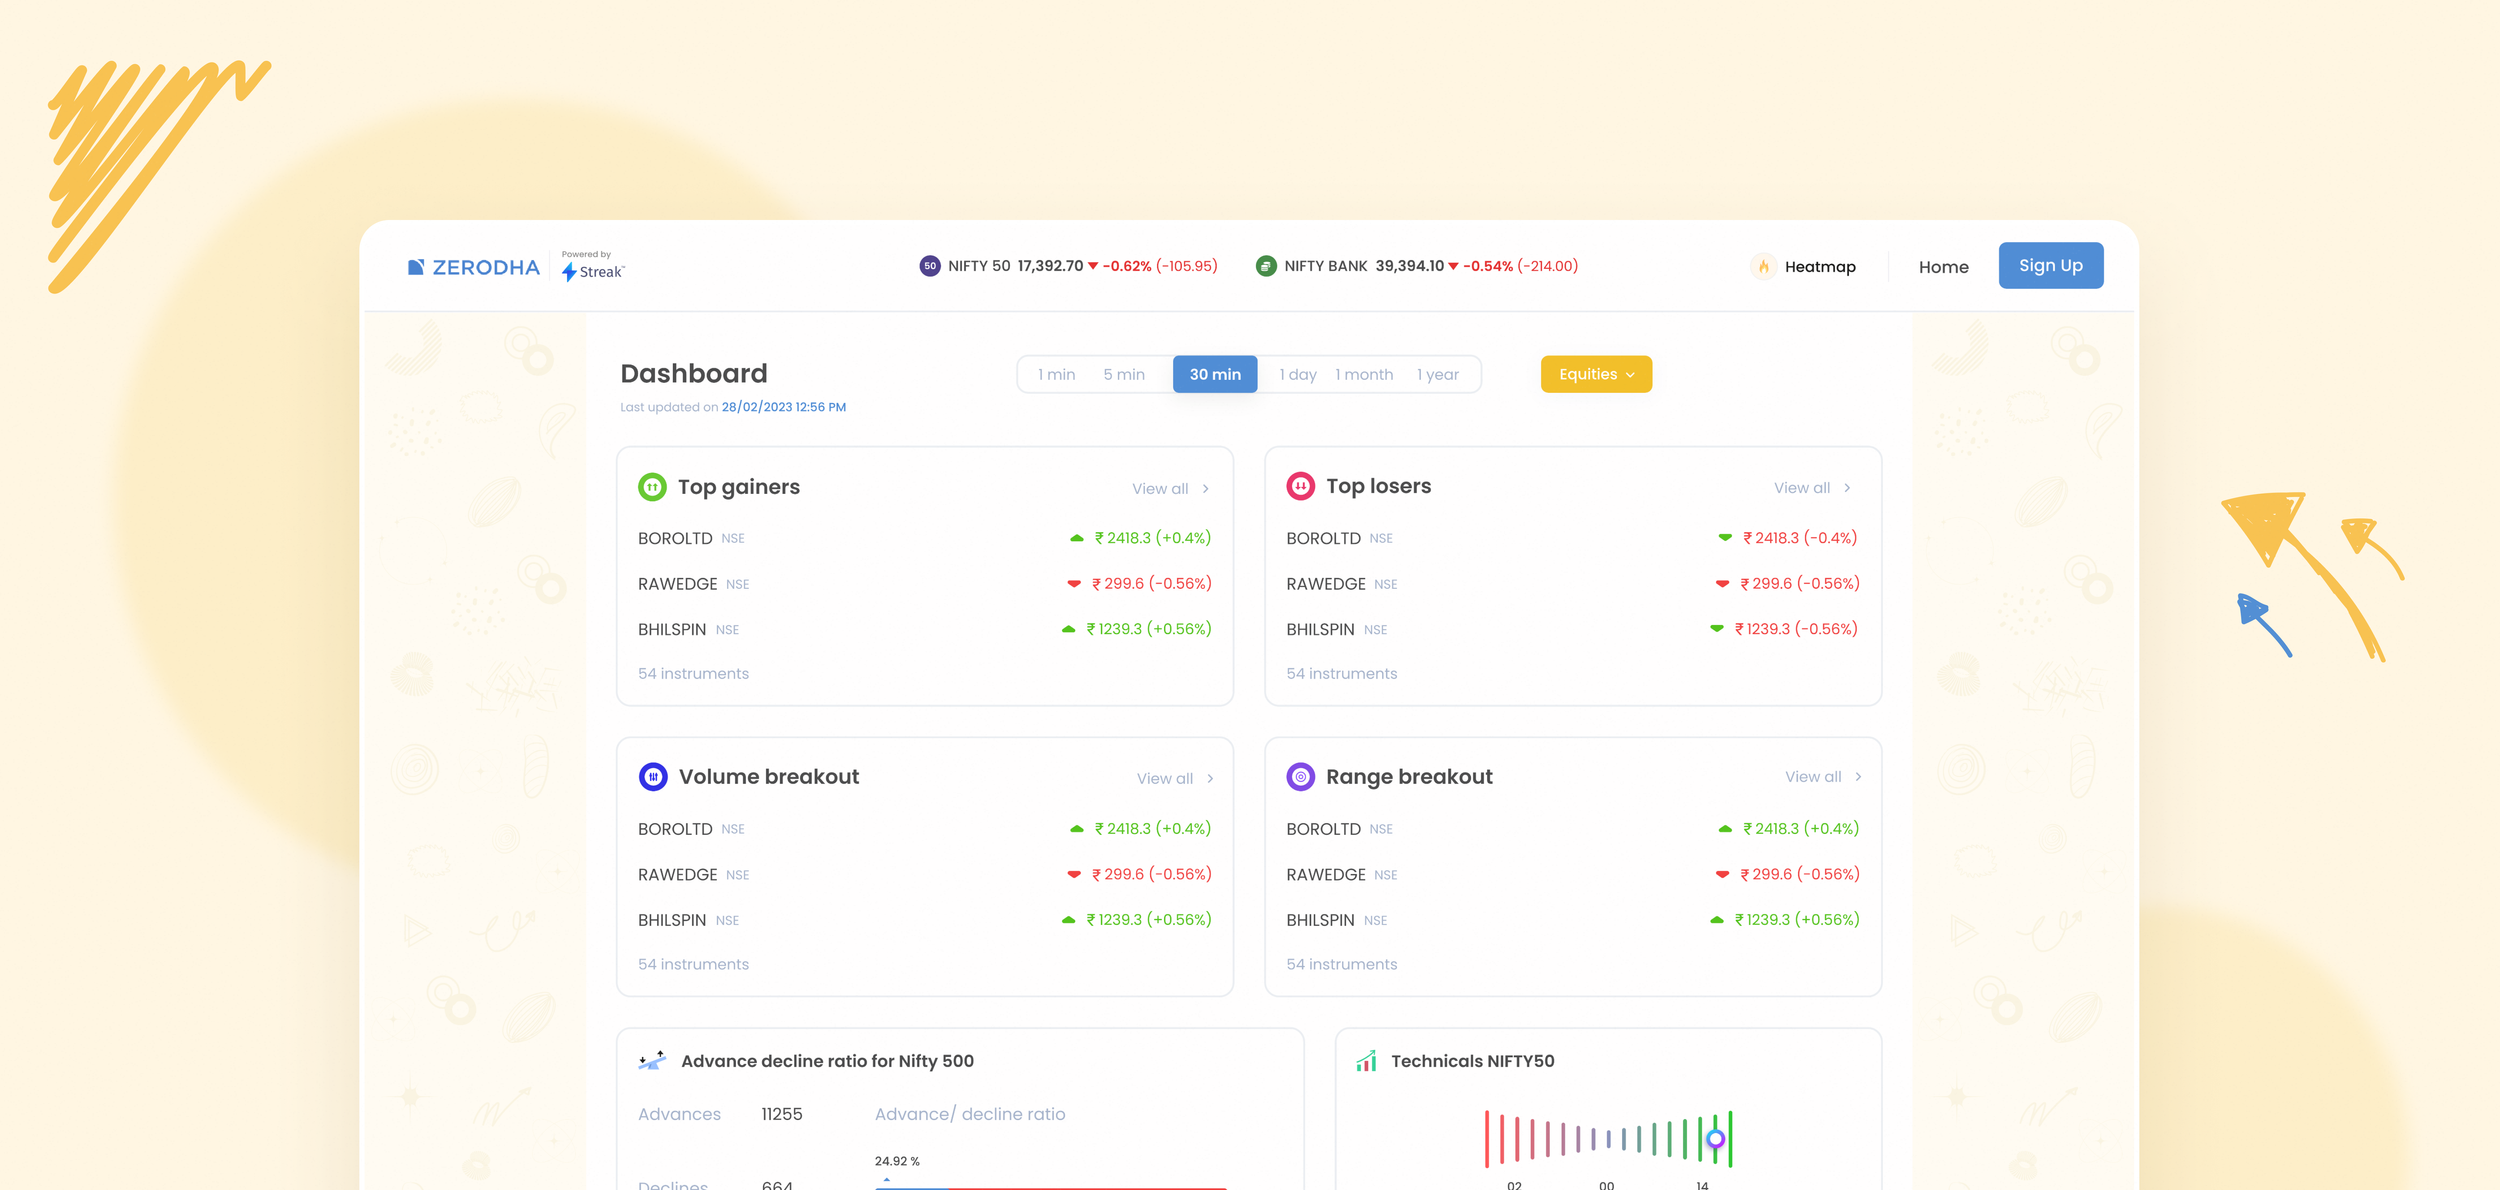
Technicals Dashboard is a dashboard that can give you a quick sense of market trends and momentum. This dashboard helps user get a quick overview of Top Gainers and Losers, Volume, and Range Breakout across all the major indices like Nifty 50, Nifty 100, Nifty 500, and Nifty Bank.
My Role
I joined Streak as the only designer in the company collaborating closely with product manager, engineers, and stakeholders to develop the market summary platform. This was my first project at streak where i designed the product from scratch. Over the course of 1.5 months i designed an easy to use market summary dashboard for traders.
Research
Research and Insights
Certainly! In my research on stock market data platforms, I found that many existing dashboards have too much information, making it hard for beginners to understand. This information overload can be overwhelming.
Moreover, a key insight emerged regarding the specific needs of traders, particularly in the realm of technical analysis. Surprisingly, the current market landscape lacks a dedicated platform catering exclusively to technicals. This gap in the market creates a noteworthy opportunity for the development of a specialized platform that addresses the unique requirements of traders seeking in-depth technical analysis tools and insights.
Ideation
Wireframes
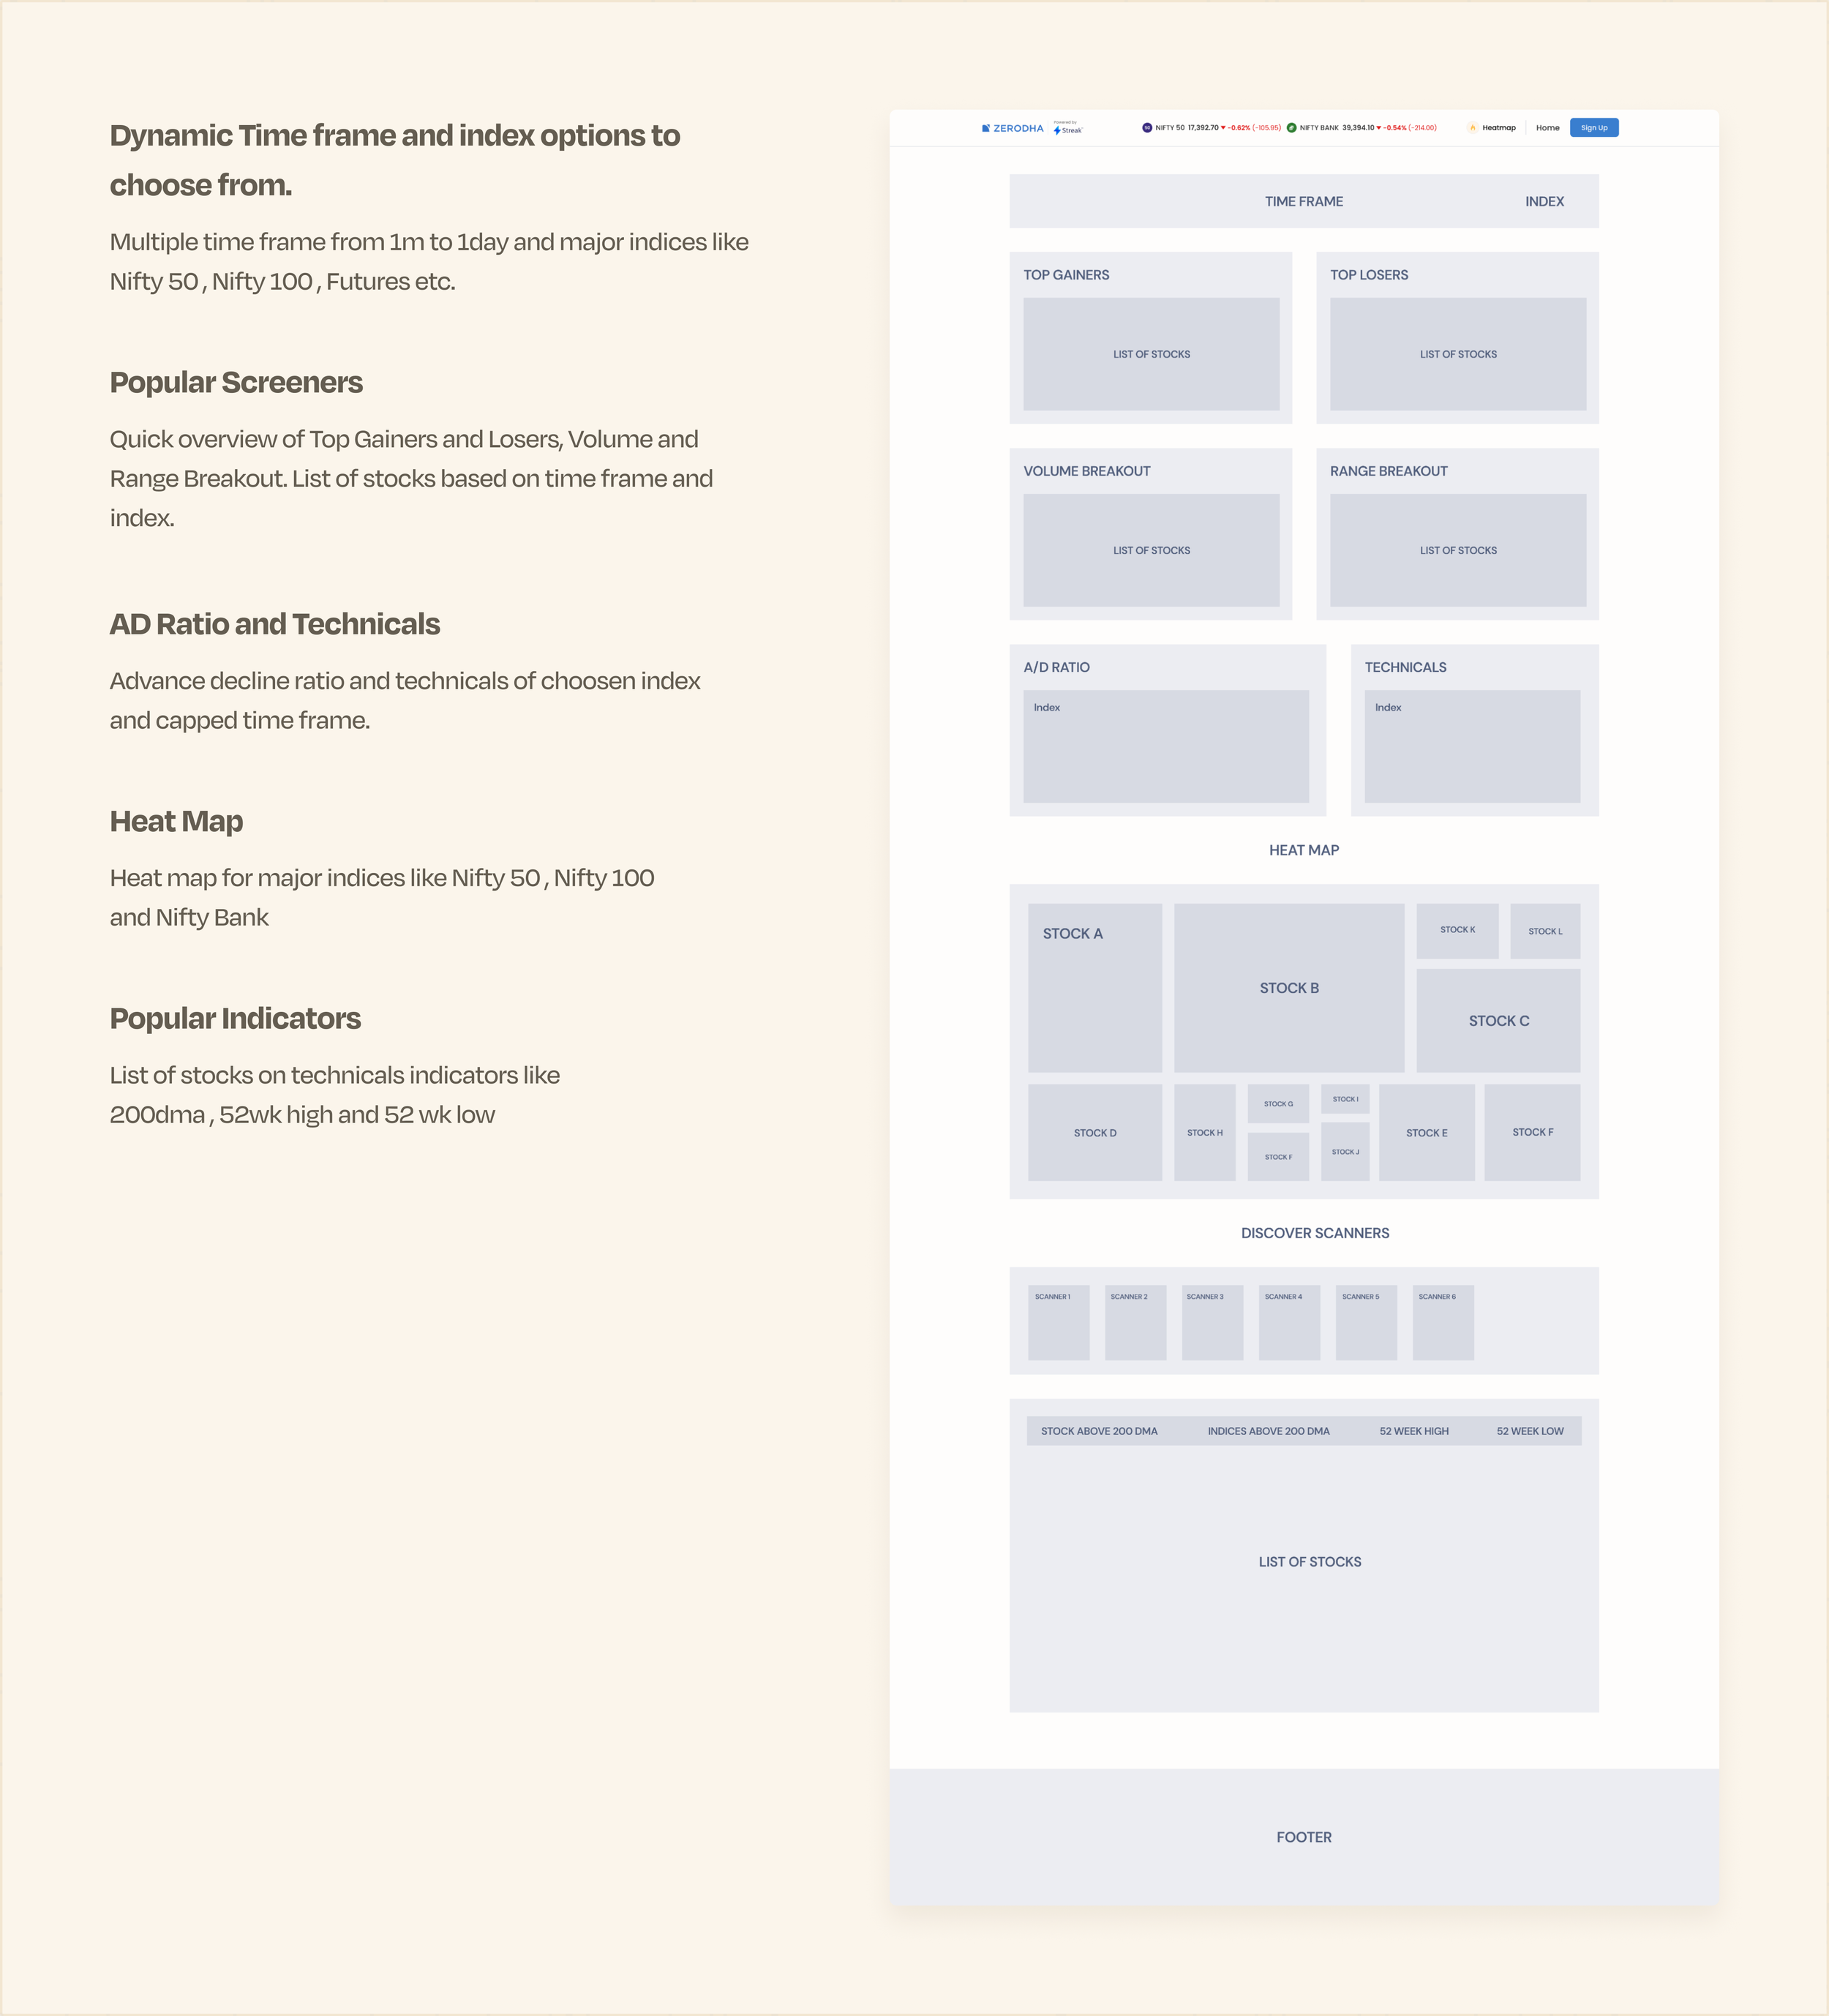
I quickly mocked up some basic wireframes to gather feedback from the team on the overall layout and structure of the dashboard.
Visual Design
Iterations
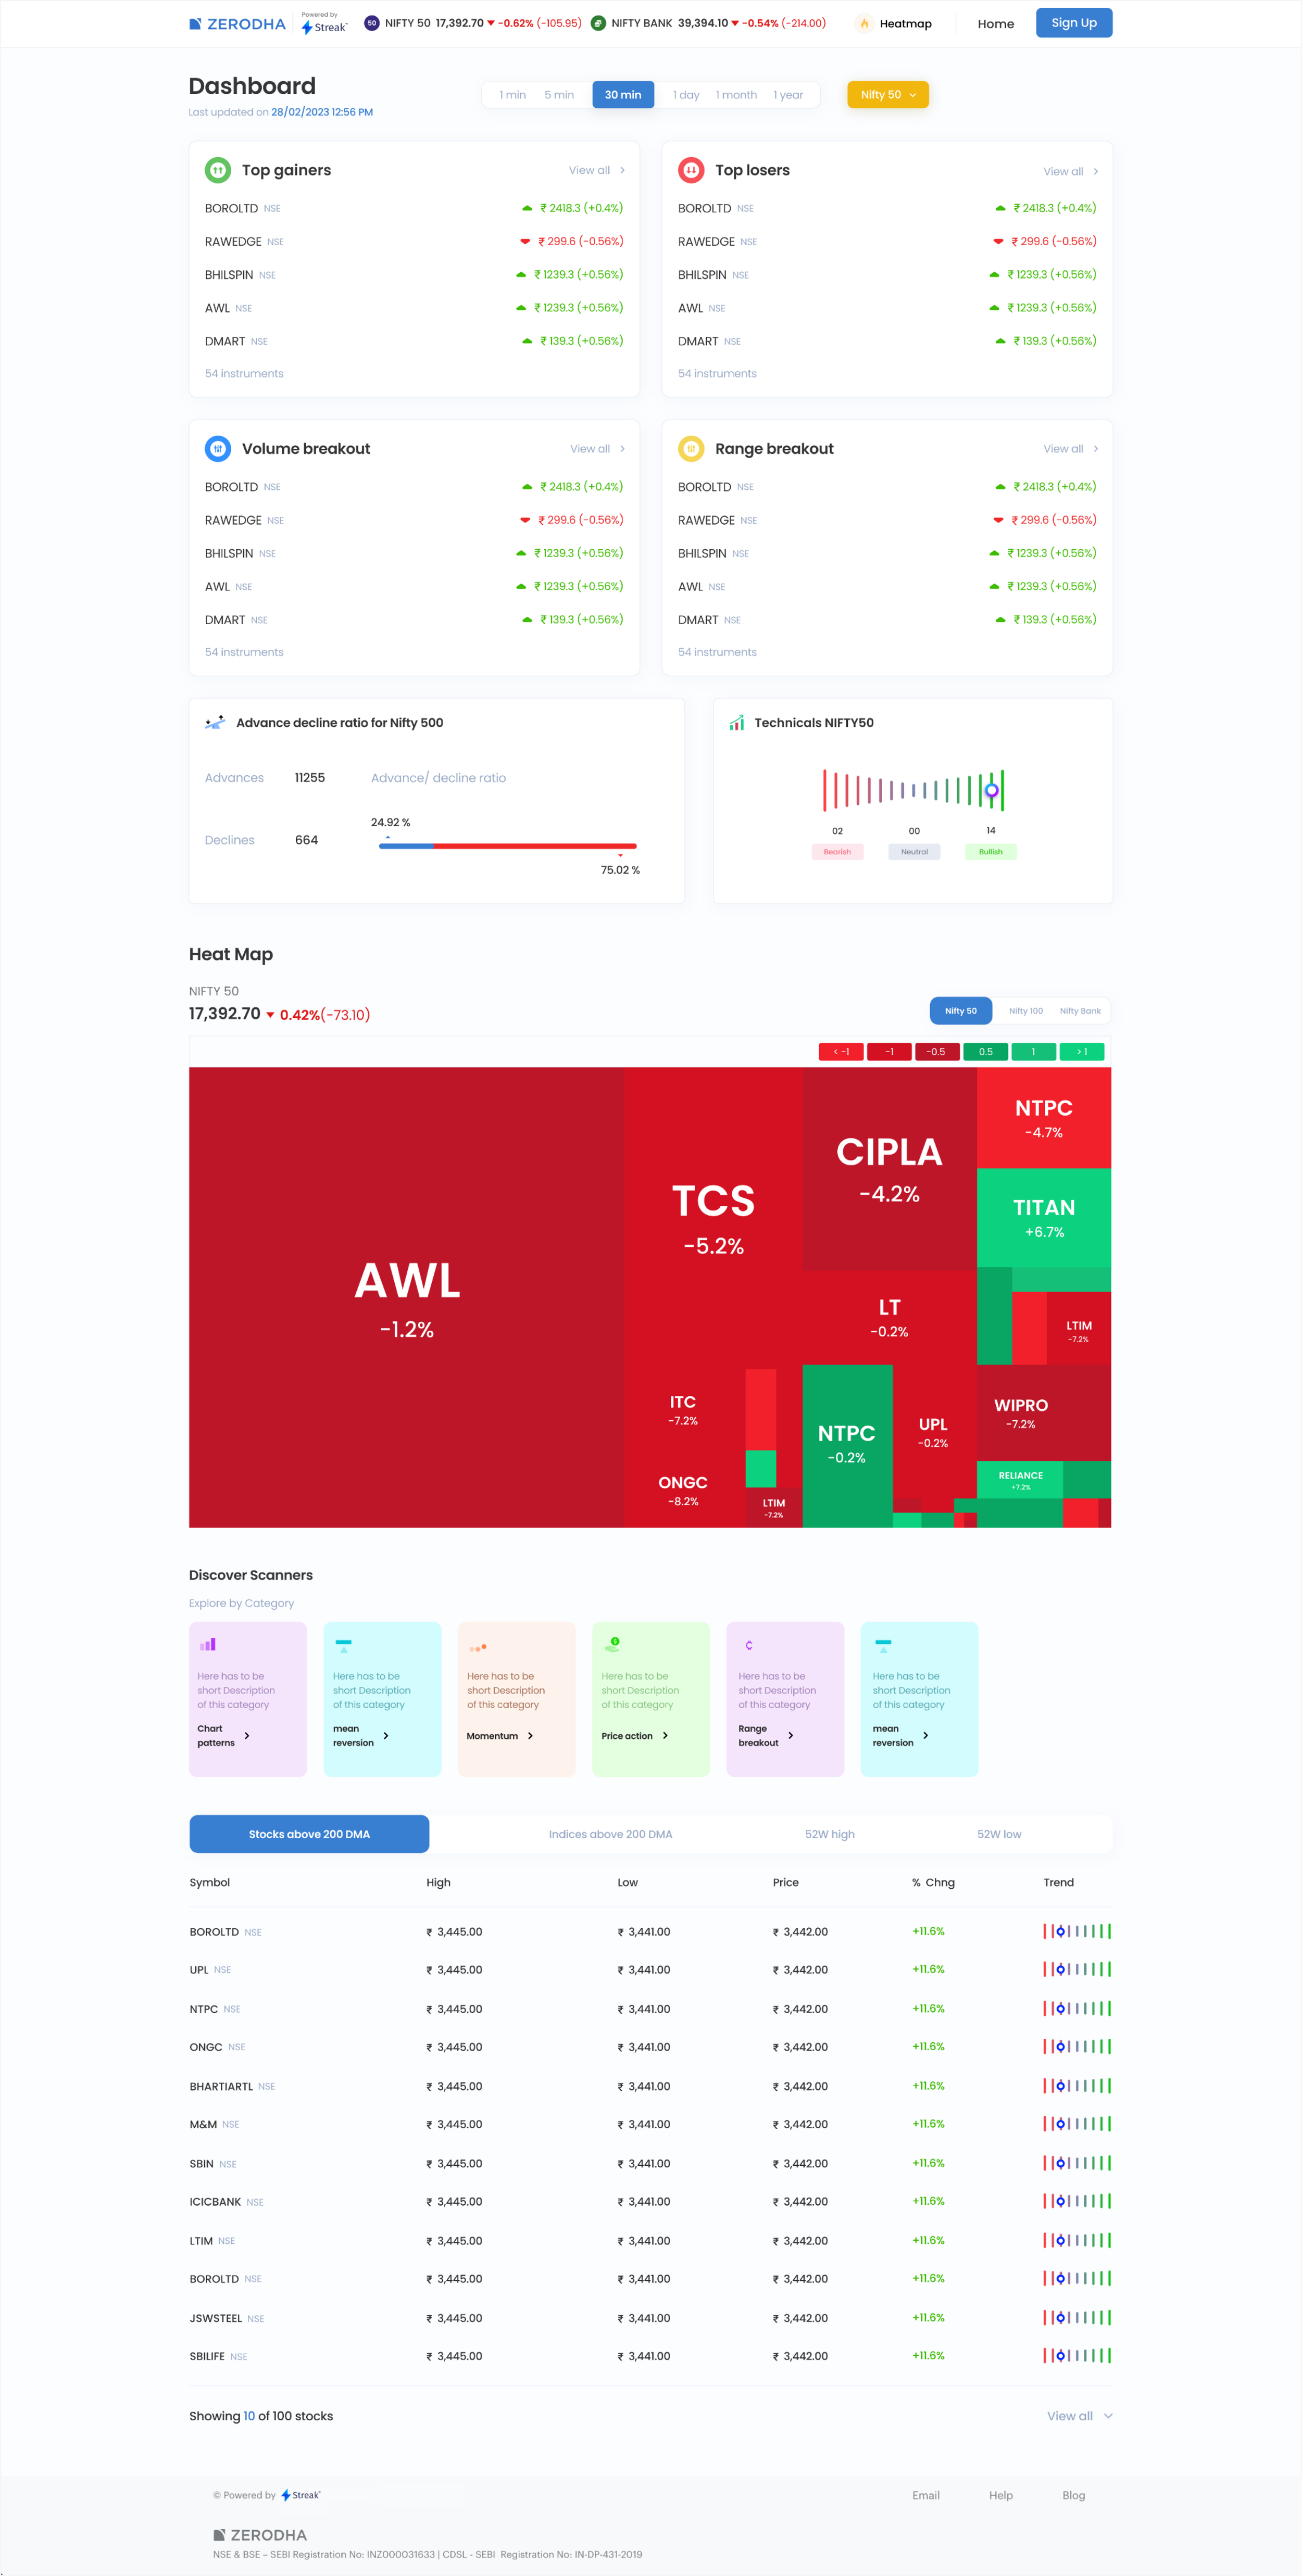
Final touches after testing.
Through our testing phase i collected some feedbacks from the users and started working on next iteration.
Touches done at last
- Making the multiple time frame option sticky. (Reduces the scroll)
- Adding a FAB icon for heatmap. (Reduces the scroll)
- Adding Nifty 50 and Nifty Bank Index at the header (Traders requirement)
Results
Overcomin Challenges , Delivering Results
Challenges
After completing the desktop version, I shifted my focus to implementing responsive design for the platform. Given the extended length of the page, assembling components on smaller devices, such as mobile, posed a challenge. This was particularly true for horizontal tables and heat maps. Through rigorous testing and multiple iterations, we successfully addressed the responsiveness issues of the platform.
Result
The designs I created were well-received by users, garnering positive feedback across various trading communities. The free and user-friendly tool successfully addressed the needs of thousands of traders, earning widespread appreciation.
Achievements
The joint venture of Zerodha and Streak has led to the Technical Dashboard attracting over 100,000 monthly users, marking a significant milestone in its impact on traders' analytical needs."